
Historical Performance
Learn more about the performance history of Delaware Statutory Trust (DST) investments and the investment firms that manage them.
1031 DST Historical Performance Data
Overall Performance Metrics
Baker 1031 Investments offers 1031 DST properties from hand-selected, institutional investment firms. As a result of our thorough due diligence process, real estate investment experience, and commitment to our clients, we believe we provide them with an exceptional platform.
Platform Sponsor Cumulative AUM ²
Average Annualized Return ³
Average Equity Multiple ⁴
Average Holding Period ⁵
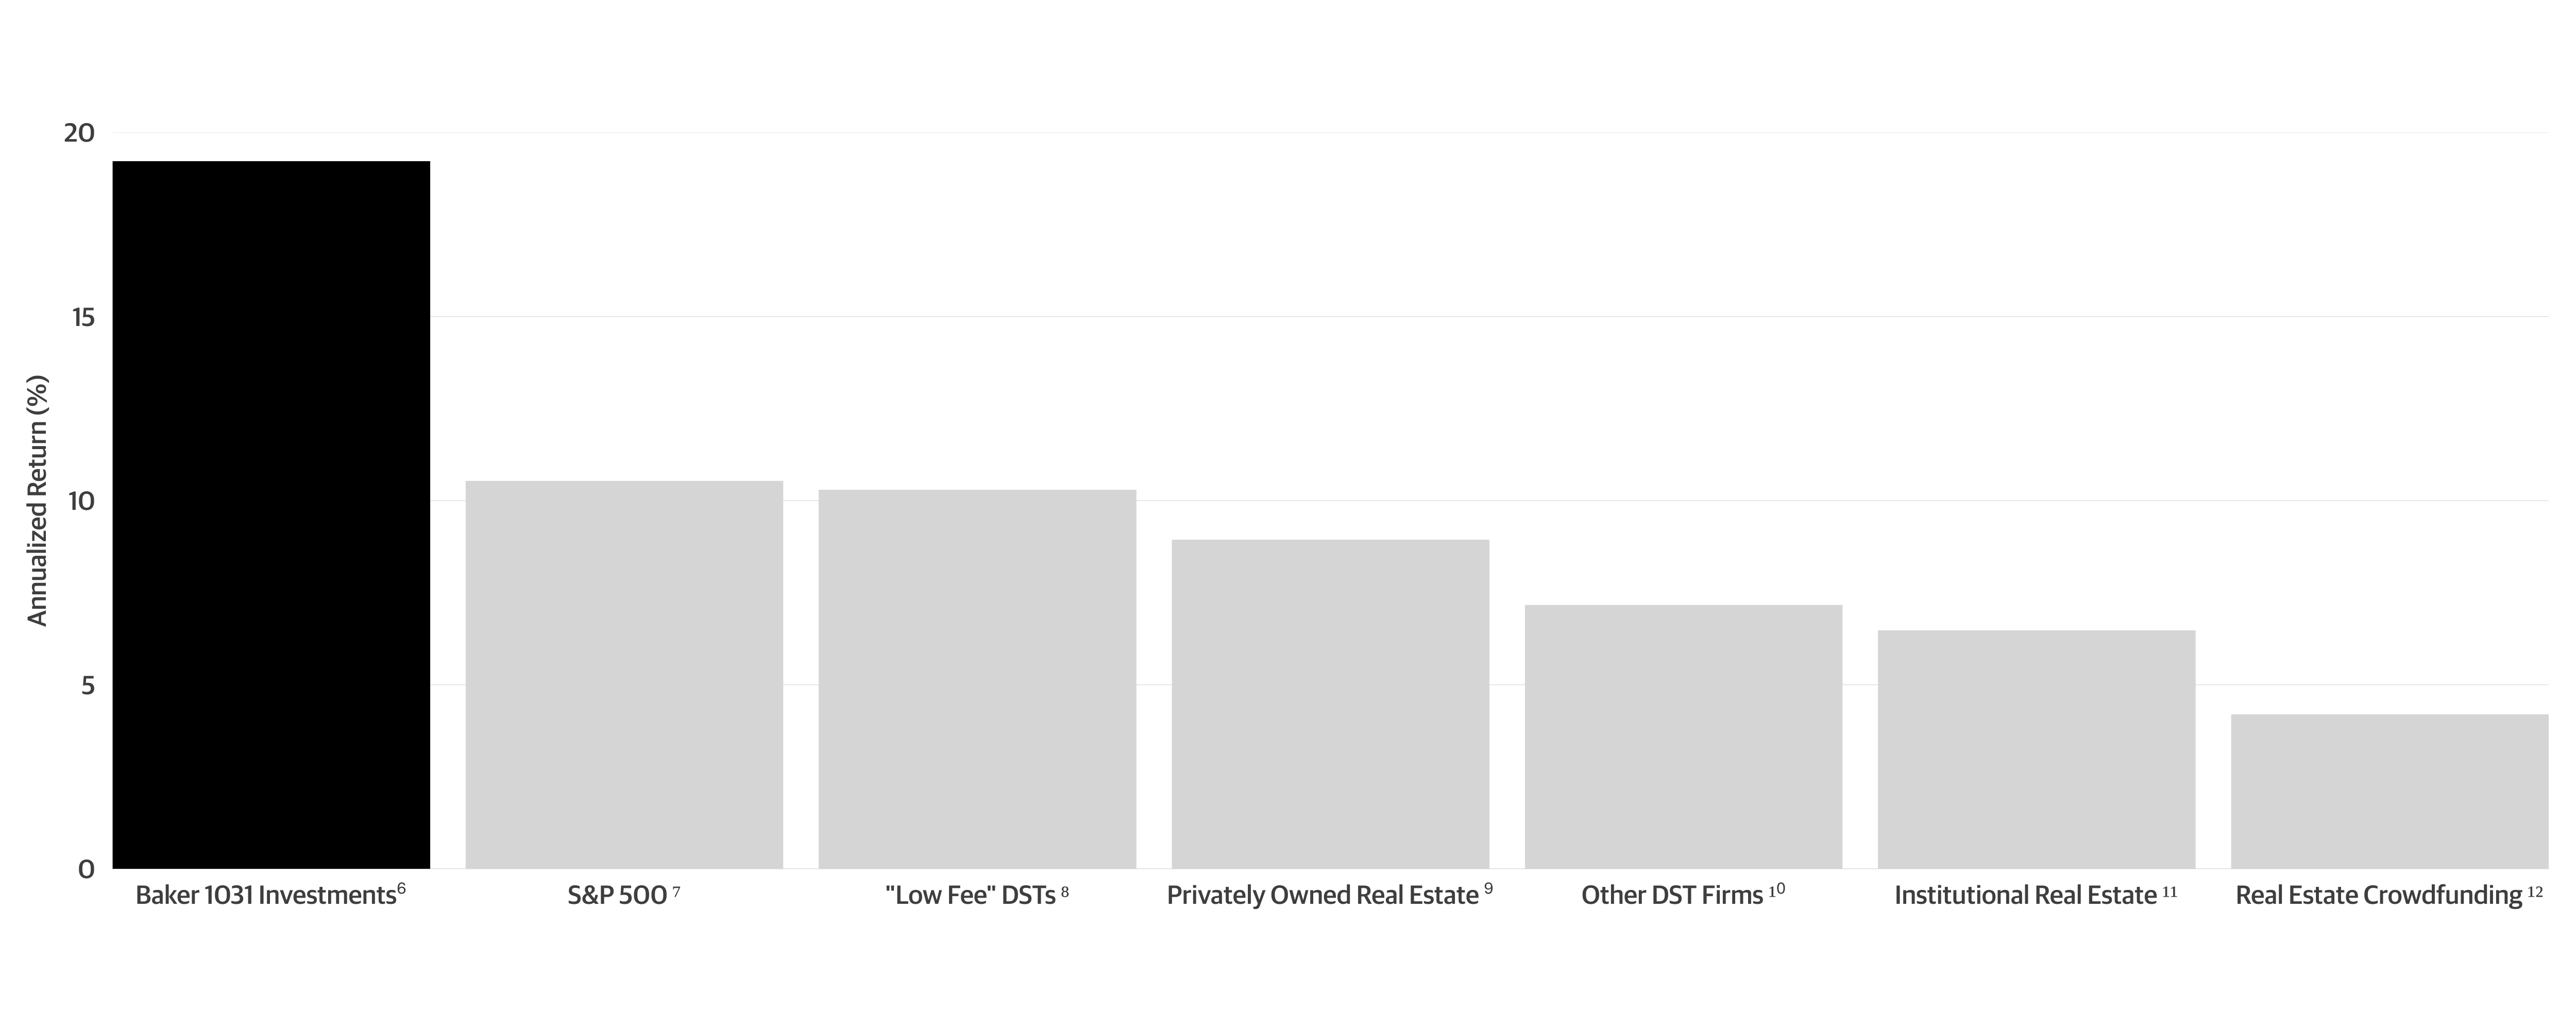
How Do DSTs Compare?
Investment Sponsor Firm Profiles
Invest Alongside Renowned Firms
The institutional investment firms and each of their offerings represented on the Baker 1031 Investments platform pass through a rigorous, multi-stage due diligence process. We enlist third-party experts to perform a thorough, regular investigation into each sponsor, underwrite each investment opportunity, and more.
Bluerock
Bluerock is a national sponsor of syndicated 1031-exchange offerings for over 18+ years with a focus on Premier Exchange Properties™ that seek to deliver stable cash flows and potential for value creation. Bluerock has structured 1031 exchanges on over $1.8 billion in total property value and over 10 million square feet of property.
22.70% Annualized Return
1.78x Equity Multiple
3.75 Year Average Holding Period
BridgeView Capital
Bridgeview Real Estate is a developer and operator of commercial real estate in Texas with a primary focus on multifamily, office and mixed use properties. Their investments are primarily high quality real estate in core or secondary markets.
34.49% Annualized Return
2.44x Equity Multiple
4.4 Year Average Holding Period
Cantor Fitzgerald
Founded in 1945, Cantor is a premier global financial services firm. Over the past decade, Cantor has invested more than $2 billion in its commercial real estate business infrastructure.
11.70% Annualized Return
1.45x Equity Multiple
3.9 Year Average Holding Period
Capital Square
Capital Square is a national real estate investment and management company. The firm sponsors institutional-quality real estate exchange programs that qualify for 1031 exchanges. The firm has completed more than $7.8B in transaction volume.
12.14% Annualized Return
1.67x Equity Multiple
5.1 Year Average Holding Period
Griffin Capital
Founded in 1995, Griffin Capital has owned, managed, sponsored or co-sponsored approximately $17.8 billion in assets. The firm’s investment strategies include diversified core real estate in sector-specific portfolios focused on net leased essential office and industrial assets, clinical healthcare properties and multifamily real estate assets.
18.04% Annualized Return
1.72x Equity Multiple
3.8 Year Average Holding Period
Net Lease Capital
Net Lease Capital is a leading investment and advisory firm in the single tenant net lease arena and have closed over $14 billion in net lease transactions. Net Lease Capital is a principal that has acquired over $6.0 billion of single-tenant, investment-grade property.
15.71% Annualized Return
2.33x Equity Multiple
5.7 Year Average Holding Period
NexPoint
NexPoint is part of a multibillion-dollar investment platform that serves both retail and institutional investors worldwide. NexPoint has conducted $20.1 billion in gross real estate transactions and operates $14.5 billion in assets under management.
16.67% Annualized Return
1.65x Equity Multiple
3.67 Year Average Holding Period
Passco
Since 1998, Passco Companies has operated throughout all market conditions and cycles. The company has acquired over $5.6 billion in multifamily and commercial real estate in the United States. Passco has $3.87 billion worth of assets under management that consists of over 13,000 multifamily units. Total real estate acquisitions exceed $7.2 billion.
10.23% Annualized Return
1.90x Equity Multiple
6.7 Year Average Holding Period
Peachtree Group
Peachtree is a private equity firm focusing on opportunistically deploying capital across its distinct operating and real estate divisions, including hospitality, commercial real estate lending, residential development and capital markets.
31.30% Annualized Return
1.62x Equity Multiple
2.1 Year Average Holding Period
Performance data from Capital Square Zero Coupon DFW Hospitality DST PPM, Performance data from Bluerock Churchill Downs DST PPM, Performance data from BridgeView BV Ernest Health DST PPM, Performance data from Cantor Fitzgerald Chestnut Street Multifamily DST PPM, Performance data from Griffin Heritage Gonzales Multifamily DST PPM, Performance data from Net Lease Capital Government Lease Holdings 2 DST PPM, Performance data from Net Lease Capital Government Lease Holdings 2 DST PPM, Performance data from NexPoint Life Sciences III DST PPM, Performance data from Passco Prism DST PPM, Performance data from Peachtree PG Phoenix West DST,
Explore More
Baker 1031 Investments LLC is a real estate securities investment broker, focused on investment solutions for real estate investors in 1031 exchanges. As a result of the firm's focus on providing custom investment solutions to their clients, Baker 1031 Investments is the chosen investment firm by nearly 30% of sophisticated real estate investors. ¹
The information herein has been prepared for educational purposes only and does not constitute an offer to purchase or sell securitized real estate investments. Such offers are only made through the Sponsor’s Private Placement Memorandum (PPM) which is solely available to accredited investors and accredited entities. DST 1031 properties are only available to accredited investors (generally described as having a net worth of over $1 million dollars exclusive of primary residence) and accredited entities only. If you are unsure if you are an accredited investor and/or an accredited entity, please verify with your CPA and Attorney.
There are material risks associated with investing in DST properties and real estate securities including liquidity, tenant vacancies, general market conditions and competition, lack of operating history, interest rate risks, the risk of new supply coming to market and softening rental rates, general risks of owning/operating commercial and multifamily properties, short term leases associated with multi-family properties, financing risks, potentially adverse tax consequences, general economic risks, development risks, long hold periods, and potential loss of the entire investment principal. Potential cash flows/returns/appreciation are not guaranteed and could be lower than anticipated.
Diversification does not guarantee a profit or protect against a loss in a declining market. It is a method used to help manage investment risk. Because investor situations and objectives vary this information is not intended to indicate suitability for any particular investor. This material is not to be interpreted as tax or legal advice. Please speak with your own tax and legal advisors for advice/guidance regarding your particular situation.
Securities offered through Aurora Securities, Inc. (ASI), member FINRA/SIPC. Baker 1031 Investments (Baker 1031) is independent of ASI. To access Aurora Securities’ Form Customer Relationship Summary (CRS), please click HERE. Baker 1031 Investments, Jerry Baker, and (ASI) do not offer legal or tax advice. Please consult the appropriate professional regarding your individual circumstances.
Client examples are hypothetical and for illustration purposes only. Individual results may vary.
This site is published for residents of the United States only. Representatives may only conduct business with residents of the states and jurisdictions in which they are properly registered. Therefore, a response to a request for information may be delayed until appropriate registration is obtained or exemption from registration is determined. Not all services referenced on this site are available in every state through every advisor listed. For additional information please contact +1 415 579 1660 or email [email protected].
¹ The statement that "Nearly 30% of all experienced real estate investors " is a market share estimate derived from an analysis of third-party market data as of October 2025, representing the proportional relationship between the Baker 1031 Investment investor database and an estimated total market of active real estate investors; this estimate is based on Crexi reporting a 2,000,000 user base, 80% of whom are assumed not to be agents/brokers, and 42% of activity dedicated to investment sales, from which a conservative assumption excludes 15.7% as non-investor service providers (e.g., appraisers, lenders), resulting in an estimated active investor market of 566,664; as the Baker 1031 Investment database comprises over 170,000 individuals or entities, this figure represents 30.00% of the estimated market.
The figures and calculations provided constitute a market share estimate based on unverified third-party data and internal assumptions utilized to define the estimated market; Baker 1031 Investment has not independently verified the accuracy of the underlying data, and the term "experienced real estate investors" is defined exclusively by this methodology and its internal assumptions. This communication is not a guarantee of future results, a testimonial, or a statement of performance for any investment product or service, and its accuracy is subject to the inherent limitations of the underlying data and the validity of the internal exclusion assumptions.
² ³ ⁴ ⁵ The calculated platform averages presented reflect a statistical average of data provided by the specific investment sponsors listed here. The figures used in these averages are collected from self-reported statistics provided directly by the respective firms within their Private Placement Memorandums (PPMs). This information is provided solely for illustrative and educational purposes and is not intended to serve as the basis for any investment decision, nor does it constitute investment advice, a recommendation, or an offer to sell or a solicitation of an offer to buy any security. All data presented is as of November 6, 2025. Due to the nature of self-reporting, the data presented may be incomplete, unverified, or subject to correction, and we make no representation or warranty as to its accuracy, completeness, or timeliness. Past performance is not indicative of future results, and all investments involve risk, including the possible loss of principal. The platform average represents a limited sample, and results from individual sponsors may vary materially. For complete underlying data, data from other investment sponsors, and/or additional detail, please contact us directly. The selection of results shown are a small fraction of the total amount of realized investments and are not guarantees of future results. There are often differences between the performance results and the actual results shown and other investments' outcomes. Delaware Statutory Trust (DST) investments are subject to volatility and loss of investor principal.
⁶ ⁷ ⁸ ⁹ ¹⁰ ¹¹ ¹² Baker 1031 Investments performance data per disclosure points 2 through 5, above. S&P 500 data per St. Louis FRED, all-time average S&P 500 data. “Low Fee” DST data per Origin Investments Growth Fund III, accessed November 6, 2025. Privately Owned Real Estate data per Fundrise, accessed November 6, 2025. Other DST Firms data per Inland historical returns, accessed November 6, 2025. Institutional Real Estate per Invesco Active U.S. Real Estate ETF accessed November 6, 2025. Real Estate Crowdfunding data per Fundrise, accessed November 6, 2025.